Leverage trading profit and loss examples explained
Leverage trading allows a trader to control a position larger than the capital deposited. A $1,000 margin at 10x controls a $10,000 position, and both profit and loss are calculated on that full $10,000, not the $1,000 committed. This amplification is the defining mechanic of all leveraged markets.
This guide works through leverage trading profit and loss examples at 10x, 20x, and 50x using consistent math so the mechanics are clear. It also covers liquidation price formulas, the effect of funding rates on open positions, and three calculation mistakes that produce systematic errors. Every number is illustrative. This is an independent educational resource; nothing here constitutes financial advice.
What is leverage trading and how does it calculate P&L?
Leverage in crypto trading means a platform extends buying or selling power beyond the margin a trader deposits. Profit and loss are calculated on the full leveraged position size, not just the margin. A 10x long position amplifies a 5% price increase into a 50% return on margin and a 5% price drop into a 50% loss on that same margin.
The core P&L formula for any leveraged position
Three numbers drive every leverage P&L calculation:
- Position size: Margin × Leverage
- Dollar P&L: Position size × Price change (%)
- Return on margin: Dollar P&L ÷ Margin × 100
The margin is the capital the trader puts up. The position size is what the exchange executes in the market. All gains and losses are measured against the margin, not the position size.
Why leverage amplifies both sides of a trade equally
Leverage does not favor the direction a trade is placed. A position that moves 5% in the trader’s favor returns 50% on margin at 10x. The same position moving 5% in the opposite direction loses 50% of margin at 10x. The amplification is mathematically identical in both directions. This symmetry is the most important structural fact in leverage trading.
Leverage trading profit examples: long positions
In a leveraged long position, profit is realized when the market price rises above the entry price. All three examples below use $1,000 of margin and show how each leverage multiple changes the dollar return and the percentage return on capital for the same underlying price movement.
Profit scenario: 10x leverage long
- Margin: $1,000
- Leverage: 10x
- Position size: $10,000
- Price move: +5%
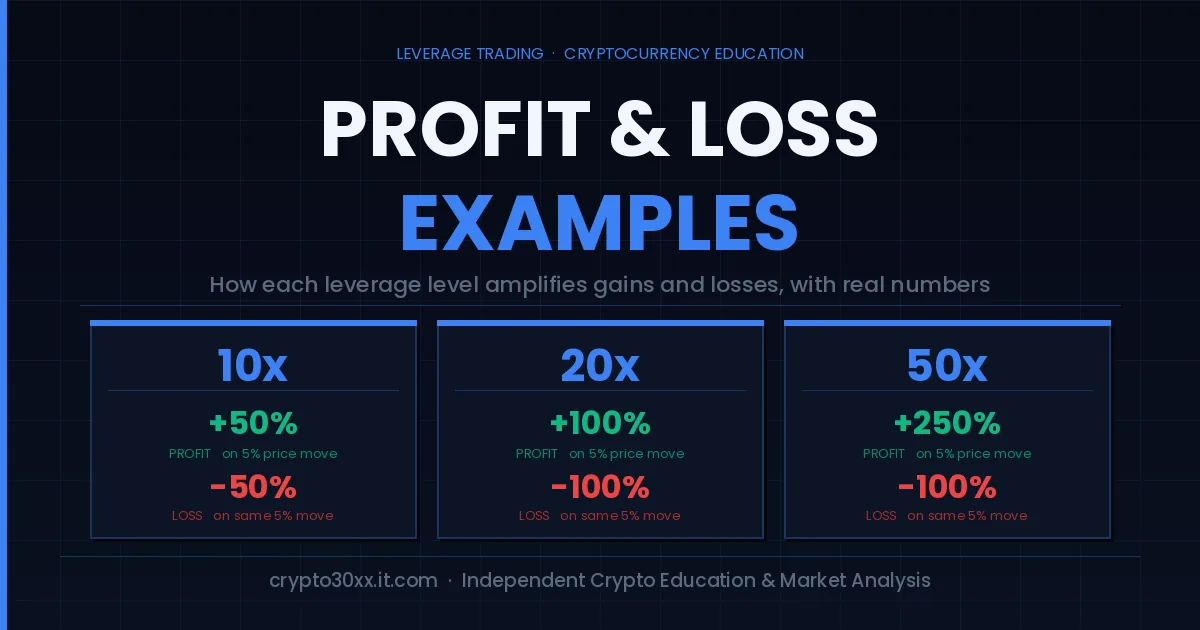
- Dollar profit: $10,000 × 5% = +$500
- Return on margin: $500 ÷ $1,000 = +50%
Without leverage, the same $1,000 invested would have returned $50 on that 5% move. At 10x, the return is ten times larger.
Profit scenario: 20x leverage long
- Margin: $1,000
- Leverage: 20x
- Position size: $20,000
- Price move: +5%
- Dollar profit: $20,000 × 5% = +$1,000
- Return on margin: $1,000 ÷ $1,000 = +100%
A 5% asset move at 20x returns the full margin as profit. The deposited capital doubles on a single-digit percentage price increase.
Profit scenario: 50x leverage long
- Margin: $1,000
- Leverage: 50x
- Position size: $50,000
- Price move: +5%
- Dollar profit: $50,000 × 5% = +$2,500
- Return on margin: $2,500 ÷ $1,000 = +250%
At 50x, the same 5% move returns 250% of deposited margin. The $50,000 position that produces this result is funded almost entirely by the platform extending the leverage.
Leverage trading loss examples: long positions
Loss in a leveraged long position occurs when price falls below the entry price. The three examples below use the same $1,000 margin and the same 5% adverse price move as the profit section above, so the symmetry between gain and loss amplification is directly visible.
Loss scenario: 10x leverage long
- Margin: $1,000
- Leverage: 10x
- Position size: $10,000
- Price move: -5%
- Dollar loss: $10,000 × 5% = -$500
- Loss on margin: $500 ÷ $1,000 = -50%
Half the deposited margin is gone on a 5% price drop. A 10% adverse move eliminates the full margin and triggers liquidation.
Loss scenario: 20x leverage long
- Margin: $1,000
- Leverage: 20x
- Position size: $20,000
- Price move: -5%
- Dollar loss: $20,000 × 5% = -$1,000
- Loss on margin: $1,000 ÷ $1,000 = -100%
The entire $1,000 margin is gone on a 5% adverse move. In practice, the platform closes the position slightly before this point, because maintenance margin requirements trigger forced liquidation before the margin balance reaches zero.
Loss scenario: 50x leverage long
- Margin: $1,000
- Leverage: 50x
- Position size: $50,000
- Price move: -2%
- Dollar loss: $50,000 × 2% = -$1,000
- Loss on margin: $1,000 ÷ $1,000 = -100%
At 50x leverage, a 2% price move erases the full margin. Crypto assets can move 2% or more within minutes during active trading sessions. This is the structural exposure that makes very high leverage positions fragile.
Comparing P&L and liquidation across leverage levels
The table below consolidates leverage levels from 2x to 100x into a single view. It uses a consistent $1,000 margin and a 5% price move so the scaling relationship between leverage, position size, and P&L impact is visible without cross-referencing multiple examples.
| Leverage | Position size | +5% profit | ROI on margin | -5% loss | Approx. liquidation threshold |
|---|---|---|---|---|---|
| 2x | $2,000 | +$100 | +10% | -$100 | -50% adverse move |
| 5x | $5,000 | +$250 | +25% | -$250 | -20% adverse move |
| 10x | $10,000 | +$500 | +50% | -$500 | -10% adverse move |
| 20x | $20,000 | +$1,000 | +100% | -$1,000 | -5% adverse move |
| 50x | $50,000 | +$2,500 | +250% | -$2,500 | -2% adverse move |
| 100x | $100,000 | +$5,000 | +500% | -$5,000 | -1% adverse move |
Liquidation thresholds are approximations using simplified isolated margin math. Actual values vary by platform, maintenance margin rate, and margin mode.
How liquidation price is calculated
Liquidation is the exchange-enforced closure of a leveraged position when remaining margin can no longer cover potential losses. Knowing the approximate liquidation price before entering a position is one of the most practically important calculations in leverage trading, more consequential in many scenarios than the profit target.
Liquidation price formula for a long position
Using simplified isolated margin math, the approximate liquidation price for a long position is:
Liquidation price ≈ Entry price × (1 − 1 ÷ Leverage)
Applied to a $100 entry price:
| Leverage | Calculation | Approx. liquidation price | Drop from entry |
|---|---|---|---|
| 10x | $100 × (1 − 0.10) | $90.00 | -10% |
| 20x | $100 × (1 − 0.05) | $95.00 | -5% |
| 50x | $100 × (1 − 0.02) | $98.00 | -2% |
| 100x | $100 × (1 − 0.01) | $99.00 | -1% |
The actual platform liquidation price sits slightly above these values. Maintenance margin requirements reduce the effective buffer, so positions are force-closed before the margin balance fully depletes.
Liquidation price formula for a short position
For a short position, liquidation triggers when price rises above the entry level:
Liquidation price ≈ Entry price × (1 + 1 ÷ Leverage)
At a $100 entry with 20x leverage on a short, the approximate liquidation price is $105. At 50x leverage, it is approximately $102. The short position carries the same structural fragility as the long at equivalent leverage levels.
Isolated margin vs. cross margin: effect on liquidation
With isolated margin, only the margin assigned to one specific position is at risk. Liquidation closes that trade and caps the loss at the allocated margin amount.
With cross margin, the platform draws from the full account balance to delay liquidation. A position that would have been closed under isolated margin may survive a temporary adverse move under cross margin. The tradeoff is that a losing cross-margin position can deplete the funds supporting other open positions before the platform finally closes it.
How funding rates affect leverage trading P&L
Perpetual futures contracts, which most crypto leverage trading uses, do not expire. A periodic payment called the funding rate keeps the perpetual contract price aligned with the underlying spot price, and this payment directly reduces or adds to realized P&L on positions held across funding intervals.
Funding rate impact: a worked example
At a funding rate of 0.01% per 8-hour interval, a $10,000 position (10x leverage on $1,000 margin) incurs:
- Per funding period: $10,000 × 0.01% = $1.00
- Per day (3 periods): $3.00
- Over 30 days: approximately $90
A position showing $500 in unrealized profit after 30 days nets approximately $410 after funding costs, before trading fees. Funding rates vary by platform and market conditions. They can shift from positive to negative as sentiment changes, which means a trader holding a leveraged position for multiple days must account for funding as a direct drag on net P&L.
Common misconceptions about leverage trading profit and loss
Several widely held assumptions about leverage trading profit and loss produce systematic calculation errors. Three of the most common involve the relationship between leverage level and profit probability, the reliability of stop-loss orders, and what a single successful trade demonstrates about strategy quality.
Misconception 1: higher leverage improves profit probability
Higher leverage narrows the gap between entry price and liquidation price. At 100x, a 1% adverse move eliminates the margin. The probability of any given 1% price move in a volatile asset is substantially higher than the probability of a sustained directional trend. Leverage level affects position size and P&L magnitude, not directional accuracy.
Misconception 2: a stop-loss fully controls the loss
Stop-loss orders reduce exposure but cannot guarantee execution at the specified price. During sharp price moves, which occur frequently in crypto markets, price can move past a stop-loss level before an order fills at that price. This is slippage. A stop placed to exit at -3% may execute at -5% or worse during fast-moving conditions.
Misconception 3: one winning trade confirms a working strategy
A single 50x trade that returns 250% on margin produces a compelling figure. One adverse move of the same magnitude wipes the entire margin. Short streaks of positive results do not establish long-term statistical edge. Consistent position sizing and defined risk parameters matter more than any individual trade outcome.
FAQs
How do you calculate profit in leverage trading? Multiply the full position size (margin × leverage) by the percentage price change. At $1,000 margin and 10x leverage, a 5% price increase generates $500 in profit, which is a 50% return on deposited margin. Losses follow the exact same formula applied in the negative direction.
What happens when a leveraged position is liquidated? The platform closes the position automatically and uses the deposited margin to cover the loss. Under isolated margin mode, the loss is capped at the margin allocated to that trade. Under cross margin, the platform may draw from the entire account balance before triggering liquidation.
How do you calculate the liquidation price for a long position? The simplified formula is: entry price × (1 − 1 ÷ leverage). At a $100 entry with 20x leverage, the approximate liquidation price is $95. Actual platform prices are slightly higher because maintenance margin requirements trigger forced closure before the balance reaches zero.
Do funding rates apply to spot margin trading? Funding rates apply specifically to perpetual futures contracts. Traditional spot margin trading uses a borrowing interest model instead. The fee structure differs materially between the two instruments, so the applicable cost depends on which contract type the platform is using.
Does leverage affect the price at which an order fills? No. Leverage changes position size and P&L amplification, not the execution price. The entry price is determined by market conditions at the moment the order fills, regardless of the leverage multiple selected.
What is the practical difference between isolated and cross margin for P&L? Isolated margin caps the maximum loss on one position to the margin allocated to it. Cross margin uses the entire account balance as collateral, which can delay liquidation on one trade but exposes all account funds to losses from that position.
Can a leveraged position lose more than the deposited margin? On most retail platforms, losses are capped at the deposited margin through auto-deleveraging and insurance fund mechanisms. In extreme price gap events or low-liquidity conditions, these mechanisms handle excess losses. Specific terms vary by platform; checking the product documentation before trading is the appropriate step.
Disclaimer
This article is produced by crypto30xx.it.com, an independent educational resource focused on cryptocurrency education and market structure analysis. Nothing in this article constitutes financial, investment, or trading advice of any kind. All calculations are illustrative only. Leverage trading carries significant risk, including total loss of deposited margin; readers should conduct independent research and, where relevant, consult a qualified financial professional before engaging in any leveraged trading activity.
Leverage trading profit and loss follow one consistent rule: every percentage move in the underlying asset is multiplied by the leverage factor when expressed as a return on deposited margin. The math applies identically to gains and losses. Knowing the liquidation thresholds, funding rate exposure, and margin mode before entering a position is what separates analytical decision-making from outcome-dependent guessing.
Find the answers you need within our gentle wisdom and feel your confidence quietly grow daily.