What is a liquidation cascade in crypto, explained
A liquidation cascade is a chain reaction in leveraged crypto markets where one set of forced position closures drives the price further down, triggering the next set, which drives it further still. Each wave of liquidations becomes the cause of the next. The result is a compounding price decline that can far exceed the initial move in magnitude, often erasing hundreds of millions of dollars in open positions within minutes. This article explains how the mechanism forms, what structural factors determine its severity, and why the concept is central to understanding crypto derivatives market behavior.
What is a liquidation cascade?
A liquidation cascade is a self-reinforcing cycle in leveraged derivatives markets where each automated position closure generates enough sell pressure to trigger the next layer of forced closures. This process requires two structural conditions: a concentration of leveraged positions clustered near similar price levels, and an initial price move strong enough to reach that first cluster. Once both conditions exist, the cascade runs as long as sell pressure from each wave is sufficient to cross into the next liquidation threshold.
How liquidation works in leveraged trading
When a trader opens a leveraged position, the exchange requires a minimum balance to hold that position open. This is the maintenance margin. If the asset price moves against the position and the trader’s balance falls below that threshold, the exchange closes the position automatically through its liquidation engine.
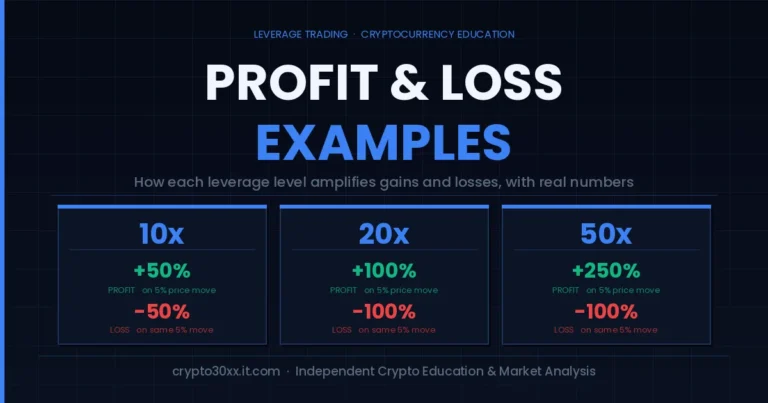
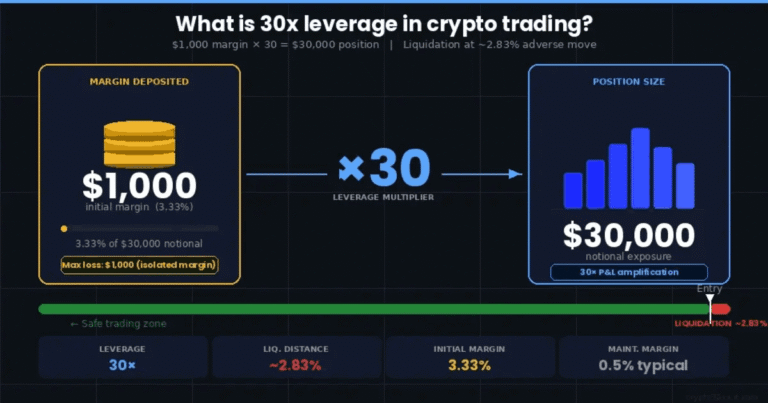
The arithmetic is direct. At 10x leverage on a $1,000 deposit, the trader controls a $10,000 position. A 10% adverse price move erases the deposit and triggers liquidation. At 25x, only a 4% move is required. At 50x, the liquidation gap compresses to 2%. High leverage ratios place liquidation prices close to entry prices, which is why heavily leveraged positions are the first to be caught in a sharp market move.
What separates a cascade from a single liquidation
A single liquidation adds a small increment of sell pressure to the market. In isolation, it is a routine occurrence on any derivatives platform. The cascade dynamic emerges when large numbers of traders have entered positions with similar entry prices and leverage ratios, pushing their liquidation thresholds into the same price band.
When a price decline reaches that band, many positions liquidate simultaneously. The combined sell pressure from that simultaneous closure is large enough to push the price into the next band, and the process repeats. The feedback loop between falling prices and forced selling is what distinguishes a cascade from any individual liquidation event.
How a liquidation cascade unfolds step by step
A liquidation cascade follows a consistent structural sequence regardless of the specific asset or market conditions. The triggering event varies, but the mechanics that amplify an initial price move into a compounding chain of forced closures follow the same path each time. Understanding this sequence explains why cascades produce price declines that far exceed their initial triggers.
Price moves past the first liquidation threshold
An initial downward price move, whether from a large market sell order, a macro shock, or a sudden drop in order book liquidity, crosses the liquidation price of the most leveraged long positions. The exchange’s automated liquidation engine identifies these positions and begins closing them, converting long exposure into market sell orders.
Liquidation engine sell orders add to market sell pressure
Each forced position closure generates a sell order. In a market with strong buy-side depth, this volume is absorbed with minimal price impact. In a market already under stress, where buy orders are thin or have been withdrawn, those sell orders push the price noticeably lower. The thinner the available liquidity at depth, the more each round of liquidations moves the price.
Lower prices trigger the next liquidation layer
The price decline from the first round of liquidations crosses into the liquidation thresholds of the next cluster of positions. These are typically positions opened at slightly lower leverage ratios or different entry prices, but still vulnerable to a move of this magnitude. The second wave of forced closures produces another batch of sell orders, pushing prices lower again.
Cascade intensifies or resolves
This process repeats with each successive layer of liquidation clusters. The cascade continues as long as the price impact of each wave is sufficient to trigger the next. It resolves when liquidity providers absorb the sell pressure at depth, the market reaches a price level where no further significant liquidation clusters exist, or the exchange’s protective mechanisms intervene.
The mechanics behind cascade severity
Not every sharp price move produces a liquidation cascade, and not all cascades are equally severe. The intensity of any given cascade depends on the structural state of the market when it begins: how much open interest is outstanding, how tightly the liquidation thresholds are clustered, and how the exchange’s liquidation mechanisms are designed to respond.
Open interest and leverage concentration
Open interest is the total notional value of all outstanding derivatives contracts on an asset. A market with $5 billion in open interest carries structurally more exposure to cascade dynamics than one with $500 million, assuming similar leverage ratios. More capital positioned in derivatives means more capital subject to forced closure if prices move sharply enough.
Leverage concentration amplifies this exposure. When the majority of open interest is held at 20x or higher, the distance between entry prices and liquidation prices across the market is narrow. A price decline of 4% can breach liquidation thresholds for positions at 25x leverage, which in a high open-interest environment translates into a large absolute volume of forced sales.
Liquidation level clustering
When many traders enter similar positions during the same price range at similar leverage ratios, their individual liquidation prices cluster near the same level. Analysts refer to these concentrations as liquidation walls. When prices reach a wall, a large volume of positions liquidates nearly simultaneously, generating a sudden and concentrated wave of sell orders.
Analytics platforms display liquidation heat maps that estimate where these clusters sit across price levels. These tools show what the forced-selling volume would look like if prices reached various thresholds, though they do not indicate when that will happen.
The role of exchange liquidation engines
Liquidation engine design varies significantly between exchanges, and those differences affect how cascades propagate. Some engines use partial liquidation, closing only enough of a position to restore margin above the maintenance threshold. Others close the entire position immediately. Full-position closures produce larger individual sell orders and can push prices further per liquidation event.
The order type used matters as well. An engine that places market orders to close positions works through the order book immediately, at whatever price is available. This speed increases cascade velocity compared to engines using limit orders, which may not execute in fast-moving markets and fall back to market orders anyway.
Insurance funds and auto-deleveraging
Most major exchanges maintain an insurance fund: a reserve of capital accumulated when positions are liquidated above their bankruptcy price. When a position cannot be closed above bankruptcy price, the insurance fund covers the difference, preventing that loss from passing to other traders.
When the insurance fund is insufficient to cover a loss, many exchanges trigger auto-deleveraging (ADL). This mechanism forces the most profitable traders on the opposite side of the market to absorb the bankrupt position’s loss by closing their positions at the liquidation price. During severe cascades, ADL can unexpectedly close winning positions held by traders who had no intention of exiting.
Liquidation cascade vs. a regular market selloff
The core difference between a liquidation cascade and an organic market selloff is that a cascade is self-amplifying while an organic selloff is not. When prices fall in an organic selloff, declining prices attract buyers who see value, creating natural stabilization. In a cascade, declining prices directly trigger automated selling, bypassing the price-discovery process that would otherwise slow the decline.
| Factor | Organic selloff | Liquidation cascade |
|---|---|---|
| Primary driver | Active seller decisions | Automated forced closures |
| Typical speed | Hours to days | Seconds to minutes |
| Order composition | Mixed market and limit orders | Predominantly market sell orders |
| Self-reinforcing | No | Yes |
| Recovery pattern | Gradual, sentiment-driven | Often sharp once liquidation clusters clear |
| Partial predictability | Low | Moderate via liquidation heat maps |
These two types of decline are not mutually exclusive. An organic selloff can transition into a liquidation cascade if the initial price decline is large enough to reach the first significant liquidation cluster. At that point, the organic and cascade dynamics compound each other, and the decline accelerates beyond what either mechanism would produce independently.
Why liquidation cascades matter for market analysis
Liquidation cascades matter because they reveal a structural amplifier built directly into leveraged crypto markets. Understanding them explains why prices in derivatives-heavy markets fall faster and further than underlying conditions would predict. They also explain why market participants who hold no leveraged positions still face price risk driven by the behavior of those who do.
The role of extreme leverage
Traditional financial markets limit retail leverage to a small multiple of capital in most jurisdictions. Crypto derivatives markets allow leverage of 20x, 50x, or even 100x on many platforms. At these ratios, the liquidation price sits within a few percentage points of the entry price. The compressed margin across tens of thousands of positions creates a market structure with high embedded sensitivity to sharp moves.
Spot markets are not insulated
A common misconception is that liquidation cascades affect only the derivatives markets where they originate. Spot prices are exposed as well. Arbitrageurs maintain price alignment between spot and futures markets continuously. When a cascade drives the futures price sharply lower, arbitrage activity transmits downward pressure to the spot market in parallel. Spot holders experience price volatility generated by forced closures they never participated in.
How cascades reveal market structure
A liquidation cascade is not primarily a story about individual traders losing money. It is a story about how market structure transmits stress under specific conditions. The cascade is the output of three structural inputs: concentrated leverage, clustered liquidation levels, and thin buy-side liquidity. When all three exist simultaneously and a triggering event provides the initial shock, the cascade runs on its own mechanics from there.
Historical examples of liquidation cascades
Liquidation cascades have occurred multiple times across crypto derivatives market history, and each well-documented event reinforces the same structural pattern. A triggering shock creates the first wave of forced closures, that pressure amplifies the initial move, and prices fall faster than organic selling alone can explain. Three events serve as clear illustrations of this mechanism at scale.
In March 2020, Bitcoin declined more than 40% within a single day during a period of acute global financial stress. The rate of decline and its magnitude were consistent with cascade mechanics. Highly leveraged long positions were systematically forced out as prices fell through successive liquidation clusters, and each round of closures accelerated the move.
The collapse of the LUNA and TerraUSD system in May 2022 generated one of the most significant multi-asset cascades on record. The de-peg event triggered liquidations across positions correlated with LUNA, and forced selling spread into Bitcoin and Ether as market participants rapidly reduced leveraged exposure. The cross-asset dimension showed how correlated positions across multiple tokens can multiply the scope of a forced-selling event far beyond the asset where it begins.
The FTX exchange collapse in November 2022 produced a cascade driven by counterparty uncertainty rather than a de-peg. As questions about exchange solvency grew, leveraged positions across multiple assets were rapidly closed, compressing prices under conditions of extreme stress and thin liquidity. Each of these events shares the same structural origin: an initial shock that reduces liquidity or confidence, an automated response from liquidation engines, and compounding price pressure that amplifies the initial move.
FAQs
What triggers a liquidation cascade? A cascade typically begins when a sudden price decline crosses the liquidation threshold of a significant cluster of leveraged long positions. The trigger can be a large market sell order, a news-driven price shock, a sharp move in a correlated asset, or thin order book conditions that allow a moderate-sized order to move price significantly. The trigger itself is often smaller than the cascade it initiates.
How fast does a liquidation cascade happen? The automated nature of exchange liquidation engines means the initial cascade stages unfold in seconds. A cascade clearing several hundred million dollars in open interest can complete in under five minutes, depending on order book depth and how densely liquidation clusters are distributed across the relevant price range.
Can a liquidation cascade push prices upward? Yes. The same mechanics apply when short positions are clustered near a level above the market. If prices rise past those thresholds, those short positions are forcibly closed through buying the asset. That forced buying adds upward pressure, which can trigger the next cluster of short liquidations in sequence. This is a short liquidation cascade, sometimes called a short squeeze.
Do all exchanges experience cascades the same way? No. Liquidation engine design, maximum leverage limits, insurance fund size, and order pricing methods all vary by platform. An exchange with lower maximum leverage and a well-capitalized insurance fund generally produces smaller, shorter cascades than a high-leverage platform with minimal reserves.
Is a liquidation cascade the same as a flash crash? They overlap but are not identical. A flash crash is any rapid price decline followed by a swift recovery and can result from algorithmic errors, large orders hitting thin markets, or other causes. A liquidation cascade is specifically a forced-closure chain reaction. Many flash crashes in crypto are partially or primarily cascade-driven, but the terms describe different phenomena.
Can liquidation cascades be anticipated? Not with precision. Liquidation heat maps estimate where the largest clusters of forced-closure thresholds are concentrated at any given time. These tools identify levels at which a cascade would be most severe if the price reached them, but they do not indicate when or whether the price will move to those levels.
What is the role of open interest in cascade risk? Higher open interest means more capital is held in derivatives positions, increasing the potential volume of forced closures at any price level. Markets with elevated open interest relative to historical norms carry greater structural exposure to cascades if a triggering event occurs, particularly when that open interest is concentrated at high leverage ratios.
How do exchanges try to limit cascade damage? Exchanges use several mechanisms: partial liquidation to reduce exposure incrementally before full closure, insurance funds to absorb losses before they affect other traders, auto-deleveraging as a last resort when the insurance fund is insufficient, and dynamic leverage limits that reduce allowable leverage during high-volatility conditions to limit the fuel for future cascades.
Disclaimer
This article is produced by crypto30xx.it.com for educational and research purposes only. Nothing in this content constitutes financial, investment, or trading advice. Leveraged trading in cryptocurrency markets carries substantial risk of loss, including the possibility of losing all invested capital. Readers should conduct independent research and consult qualified financial professionals before making any financial decisions.
A liquidation cascade is one of the defining structural features of crypto derivatives markets. It explains why prices can fall significantly faster and further than underlying conditions would suggest, and why the market architecture built around high leverage carries embedded amplifiers that activate under stress. The cascade itself is not random: it follows directly from concentrated leverage, clustered liquidation levels, and insufficient buy-side depth. Understanding these inputs is the foundation of understanding how liquidation cascades form and what determines how far they run.
Let our tender space remind you that your questions deserve real answers inside our gentle library.