Tokenomics explained: the complete beginner guide
Tokenomics explained: Tokenomics is the study of how a cryptocurrency token is designed, issued, distributed, and governed over time. It combines “token” and “economics” to describe the full set of rules determining a token’s supply at any moment, who holds it, what purpose it serves within its protocol, and what mechanisms push supply higher or lower. For anyone researching a crypto project — whether as an analyst, a student, or simply a curious observer of blockchain economics — tokenomics is the starting point. A project can have elegant technology and still collapse because its token design creates misaligned incentives. Understanding the mechanics covered in this guide helps separate structural strength from surface-level marketing.
What is tokenomics and why does it matter?
Tokenomics is the complete economic design of a token: how many exist, how they enter circulation, who receives them, what they are used for, and what forces change supply over time. It matters because a token’s price and adoption are downstream of its structure. Supply that grows faster than demand mechanically pressures price downward; a token with no genuine utility has no fundamental reason to be held. Researchers and analysts study tokenomics not to predict prices but to assess whether a project’s incentive structure is self-sustaining or fragile.
The term is informal but widely accepted. You will encounter it in whitepapers, audit reports, DeFi research forums, and academic papers on mechanism design. In practice, it covers six overlapping topics: supply type, supply schedule, token distribution, vesting and lockups, token utility, and supply adjustment mechanisms like burning or minting.
Tokenomics as YMYL research material
Tokens are financial instruments in nearly every practical sense. Decisions based on faulty analysis can result in real losses. This guide is written for learners and researchers who want to understand these mechanics analytically, not as financial advice and not as a recommendation on any specific token.
Token supply: the three numbers every researcher checks first
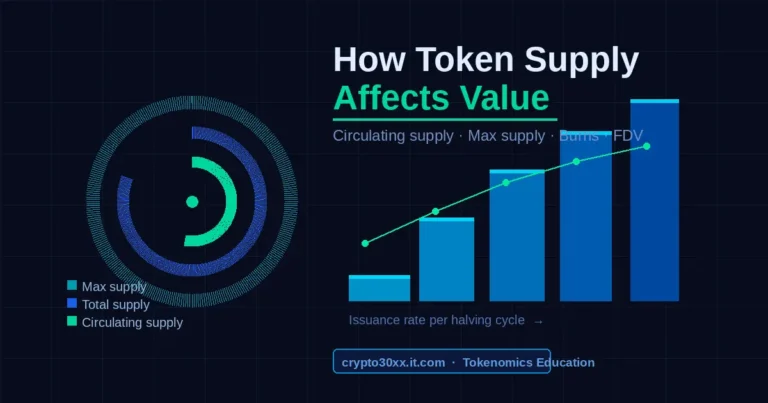
Token supply has three distinct measurements. Confusing them is one of the most common beginner mistakes, and some projects deliberately choose which number to highlight in marketing materials.
| Supply type | Definition | What it signals |
|---|---|---|
| Max supply | The hard ceiling; no more tokens can ever exist | Fixed scarcity; predictable long-run dilution |
| Total supply | All tokens created so far, minus any permanently destroyed | Current issuance level, regardless of circulation |
| Circulating supply | Tokens actively tradeable on the open market | The float — what the market is actually pricing |
Bitcoin’s max supply is 21 million. Its total supply climbs with each block reward until it converges to that ceiling over roughly a century. Ethereum has no max supply cap; its issuance rate is controlled by protocol parameters, and a burn mechanism introduced via EIP-1559 can make it net deflationary in periods of heavy network use.
Fully diluted valuation and why it distorts perception
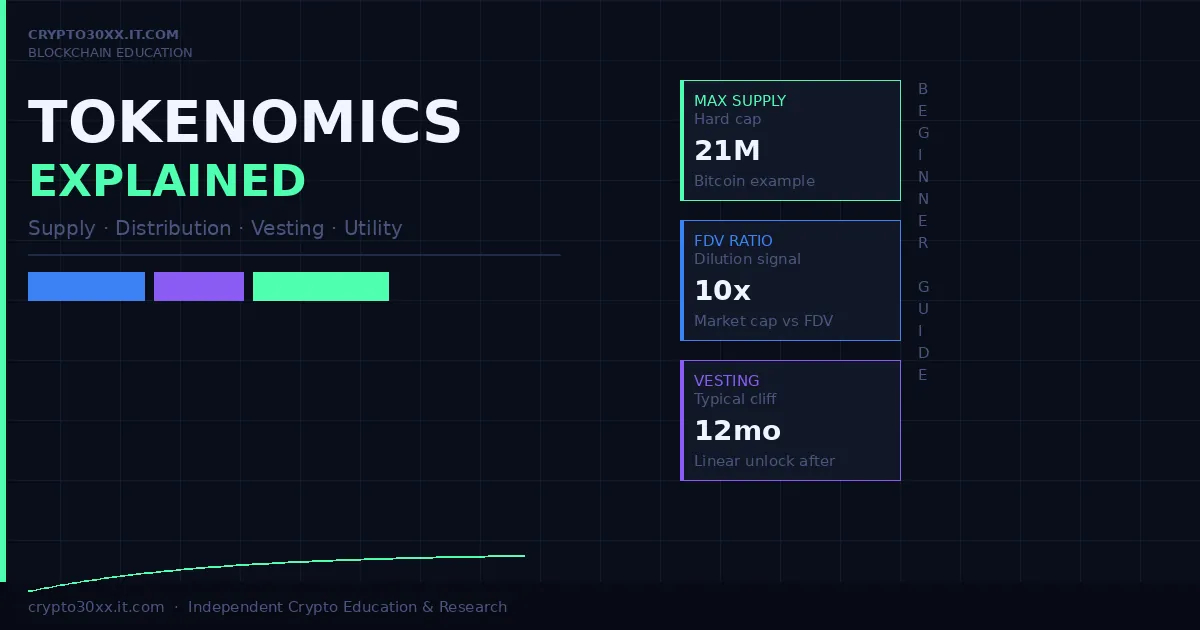
Market capitalization is calculated by multiplying circulating supply by price. Fully diluted valuation (FDV) multiplies max supply by price, revealing what the project would be worth if every token that will ever exist were already on the market. A token with a $500 million market cap and a $5 billion FDV signals that 90% of its supply has not yet entered circulation.
That future issuance represents sustained selling pressure waiting to arrive. As locked tokens unlock over months and years, new supply enters the market regardless of whether demand has grown to absorb it. Researchers use the market cap to FDV ratio as a rough measure of how much supply-side dilution lies ahead.
How tokens enter circulation: distribution and allocation
Every token starts with an allocation decision: who receives the initial supply, in what proportions, and under what conditions. This is documented in a project’s whitepaper, tokenomics paper, or on-chain governance records.
Typical allocation categories
- Team and founders: Reserved for the founding team, usually 10-20% of total supply. The vesting schedule attached to this allocation signals how long-term the team’s commitment actually is.
- Private investors: Venture capital and seed-stage allocations. These investors receive tokens at a discount to the eventual public price, which creates inherent selling pressure once their lockup expires.
- Public sale or token launch: Tokens sold to the public via an ICO, IDO, or similar mechanism. This is typically a smaller percentage than private allocations.
- Ecosystem and treasury: Reserved for future development, grants, partnerships, and protocol operations. A large, well-governed treasury gives a project long-term operational runway.
- Community and rewards: Distributed through liquidity mining, staking rewards, airdrops, or usage incentives. This category funds user growth but can dilute early holders.
- Protocol reserve: Held for emergency backstop functions or future governance decisions, often controlled by a multisig or DAO.
Reading an allocation chart critically
A pie chart showing 40% going to “community” sounds generous. The critical questions are: how quickly does that 40% enter circulation, and what incentive does each recipient have to hold versus sell?
Community tokens distributed through liquidity mining often sell immediately. The user earned them as yield and has no attachment to the project. Team tokens under a four-year vesting schedule with a one-year cliff represent a much stronger alignment signal. Allocation percentages tell you very little on their own; the schedule and recipient behavior matter far more.
Vesting schedules and lockups: when supply actually becomes supply
A vesting schedule defines the timeline over which tokens move from an allocation pool into open circulation. It is one of the most consequential and most overlooked elements of tokenomics research.
Common vesting structures
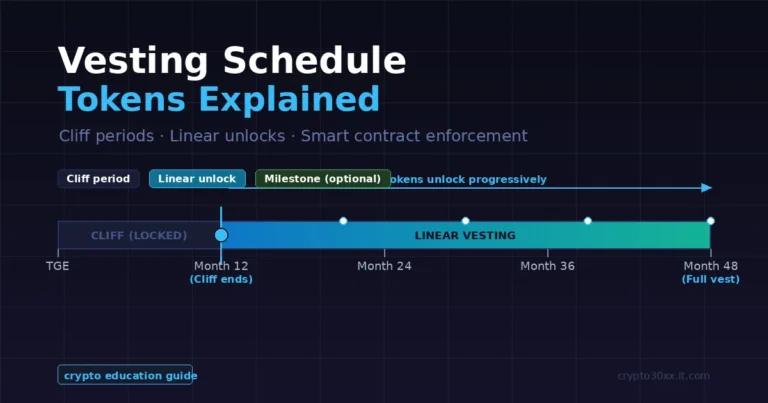
The standard structure for team and investor allocations is a cliff-plus-linear model. The cliff is a waiting period during which no tokens unlock; after the cliff, tokens release in equal instalments over a remaining period.
A concrete example: a 12-month cliff, then linear monthly unlocks over 36 months. Nothing releases in the first year. From month 13 to month 48, one thirty-sixth of the allocation releases each month. This structure gives founders and investors a reason to build value before they can exit.
Flat or absent vesting is a warning sign. When investor allocations carry only a 3-month lockup followed by full release, the project’s launch is structurally the exit opportunity for early backers, not the start of a long-term collaboration.
Cliff events and unlock schedules
Large unlock events, when a cliff expires and a substantial quantity of tokens enters circulation simultaneously, are visible in advance from public vesting data. Researchers track these dates because they represent a scheduled increase in potential selling pressure. Whether that pressure materializes depends on the unlock recipient’s incentives and the conditions at that time. A team with a strong track record has less reason to liquidate; a private investor sitting on a large gain has more.
Many analytics platforms publish real-time unlock calendars, making it possible to see exactly when major allocations become liquid. Checking this before researching a project’s near-term prospects is basic due diligence.
Token utility: what the token is actually for
A token with no structural utility is purely speculative. Its price depends entirely on the willingness of the next buyer to pay more than the current holder did. A token with genuine utility has demand sources independent of speculation — users need it to access a service, pay fees, participate in governance, or earn protocol rewards.
Four core utility types
Fee payment: The token is required to pay for transactions or services on the network. ETH is the clearest example; every Ethereum transaction requires ETH for gas. This creates demand that scales with network usage rather than solely with investor sentiment.
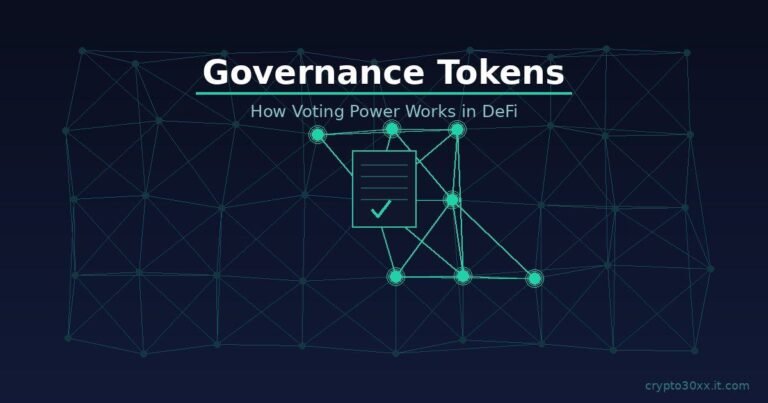
Governance: Token holders vote on protocol changes, parameter adjustments, treasury spending, and upgrade proposals. Governance utility gives holders influence over the protocol’s direction. Its actual value depends on how meaningful those governance decisions are in practice.
Access and staking: Some protocols require users to stake a minimum quantity of tokens to access premium features, participate as validators, or run infrastructure nodes. Staked tokens are locked in a contract, reducing circulating supply for the duration of the stake.
Collateral and liquidity provision: Tokens used as collateral in lending protocols or paired in liquidity pools serve an economic function within DeFi. They earn fees or interest but carry protocol-specific risks like liquidation and impermanent loss.
Distinguishing real utility from documented utility
A whitepaper can describe any utility mechanism. The relevant question is whether that utility generates actual, recurring on-chain demand. A governance token in a protocol with no active governance is not generating governance-driven demand regardless of what the documentation says.
Researchers verify this with on-chain data: Is governance actively used? Are protocol fees genuinely significant relative to token market cap? Does staking participation show up at meaningful rates? Real utility shows up in observable behavior, not in documents.
Supply adjustment mechanisms: inflation, deflation, and burns
Beyond the initial allocation, many tokens have ongoing mechanisms that change supply over time.
Inflationary issuance
Proof-of-stake protocols typically issue new tokens as validator rewards. This is a form of inflation: the total supply grows each year. If a protocol issues 8% new tokens annually, a holder who is not staking loses 8% of their relative ownership share per year even if the token price holds flat. Some projects publish a scheduled issuance curve that declines over time; others have fixed ongoing inflation. Understanding the current rate and trajectory is essential for any long-term analysis.
Deflationary mechanisms and token burns
A burn is the permanent destruction of tokens. They are sent to an address from which they can never be retrieved, reducing total supply. Burns can be:
- Fee burns: A portion of transaction fees is destroyed rather than paid to validators (Ethereum’s EIP-1559 works this way)
- Buyback-and-burn: The protocol uses revenue to repurchase tokens on the open market and destroy them
- One-time burns: Unused treasury or ecosystem allocations are burned to signal supply discipline
Whether a burn is economically meaningful depends on scale. A protocol burning 1% of supply while issuing 10% is still net inflationary. Comparing burn rate to issuance rate gives the effective net change in supply.
Comparison: inflationary vs deflationary vs capped supply
| Supply model | Example | Key consideration |
|---|---|---|
| Hard cap, no ongoing issuance | Bitcoin (21M max) | Known scarcity; miner reward shifts to fees over time |
| Deflationary (burn > issuance) | Ethereum in high-activity periods | Supply shrinks; depends on sustained network demand |
| Inflationary (issuance > burn) | Many PoS networks with fixed reward schedules | Holding without staking dilutes relative ownership |
| Fixed initial, no new issuance | Many layer-2 governance tokens | No inflation, but also no protocol-funded security rewards |
Common tokenomics red flags in research
Not every poor token design is dishonest, but certain patterns appear consistently in projects that fail structurally.
High FDV relative to market cap: A ratio above 10x means more than 90% of supply has not yet entered circulation. The scale of future dilution is material.
Short or absent vesting for insiders: If founders and early investors have no meaningful lockup, the launch is their liquidity event. Long-term development has no structural incentive attached.
Concentration in few wallets: On-chain data shows whether a small number of wallets control a disproportionate share of circulating supply. High concentration creates governance capture risk and execution risk; a handful of coordinated sellers can move markets significantly.
No documented utility demand: If the token’s role within its own protocol is unclear or unverifiable on-chain, its demand is purely speculative.
Opaque team allocation: Projects that obscure how many tokens the team holds, or under what schedule those tokens unlock, are withholding structurally important information.
FAQs
What is tokenomics in simple terms? Tokenomics is the set of rules governing a cryptocurrency token’s supply, distribution, and purpose. It determines how many tokens exist, who holds them, when new ones enter circulation, and what they are used for. Understanding these rules helps researchers evaluate whether a project’s economic design is sustainable.
What is the difference between circulating supply and max supply? Circulating supply is the number of tokens actively tradeable right now. Max supply is the hard ceiling — the total that will ever exist. The gap between the two represents tokens not yet in circulation: still locked, unvested, or unmined. That gap measures future dilution.
What does FDV mean in crypto? FDV stands for fully diluted valuation. It is calculated by multiplying a token’s current price by its total max supply, representing the theoretical market cap if every token that will ever exist were already circulating. Researchers use it to gauge how much supply expansion the market has not yet absorbed.
Is high inflation bad for a token? High inflation is not automatically harmful, but it creates downward pressure on price unless demand grows at least as fast as supply. Protocols distributing inflationary rewards to stakers are paying security providers and redistributing to active participants. Whether that works depends on the relative rates and how the market absorbs new supply over time.
What is a token burn and does it always increase price? A token burn permanently removes tokens from supply. It does not automatically increase price. Burns reduce supply, but price depends on demand as well. A burn that is small relative to ongoing issuance may have no observable price effect. The economic significance of any burn depends on its scale relative to total supply and new issuance.
What is a vesting cliff in crypto? A vesting cliff is a waiting period during which no tokens unlock. After the cliff expires, the allocation begins releasing on a schedule. A one-year cliff on team tokens means founders cannot sell any allocation for at least twelve months after launch, aligning their incentives with the project’s medium-term development.
What is the difference between a utility token and a governance token? A utility token is required to pay fees or access services on a protocol. A governance token gives holders voting rights over protocol decisions. Many tokens combine both functions. The distinction matters because governance-only tokens derive value from the importance of governance decisions, while utility tokens carry demand tied to actual protocol usage.
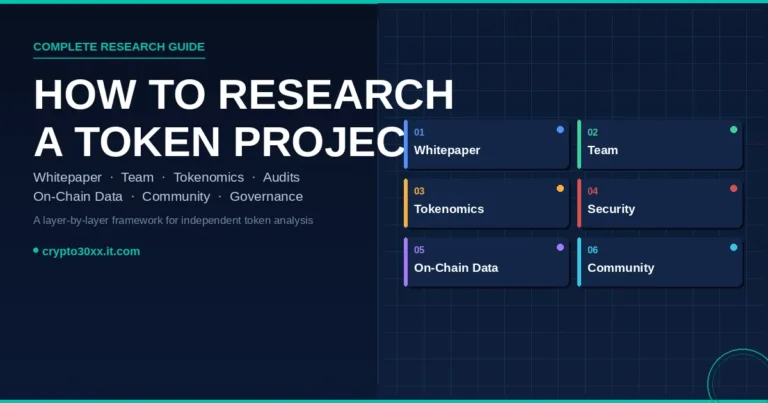
How do I find a project’s tokenomics data? The primary source is the project’s whitepaper or dedicated tokenomics documentation on the official website. On-chain data, viewable through block explorers and analytics tools like Token Terminal, Etherscan, and Nansen, shows actual wallet distribution, unlock events, and staking participation. Always cross-reference official documentation against on-chain reality.
Disclaimer
This article is written for educational and research purposes only. It does not constitute financial advice, investment advice, or any recommendation to buy, sell, or hold any cryptocurrency or digital asset. Tokenomics analysis describes structural mechanics; it does not predict future prices or guarantee any outcome. Crypto markets carry substantial risk of loss. Always conduct independent research before making any financial decision.
Tokenomics is not a single number to look up. It is a framework for understanding how a protocol’s economy is designed and whether that design is internally coherent. Supply type, distribution, vesting schedules, utility mechanics, and ongoing issuance or burn dynamics all interact. A project can appear scarce based on circulating supply while sitting on an enormous unvested allocation. It can claim deflation while issuing far more than it burns. Learning to read these structures systematically, and verify them against on-chain data, is one of the more durable skills in crypto research.
Our featured voices carry the kind of soft wisdom that lasts long after you finish reading it.