How token supply affects value in cryptocurrency
How token supply affects value in cryptocurrency: Token supply is one of the most direct levers that shapes a cryptocurrency’s value. When the number of tokens in circulation changes — through new issuance, burning, or scheduled halvings — the economic relationship between supply and demand shifts. A token with a shrinking supply and steady demand will tend toward higher per-unit value; one whose supply expands faster than demand will dilute the value held by existing participants. This guide explains the mechanics behind these dynamics, covering the different supply models in use, how analysts measure supply impact, and what warning signs to watch for when reading a project’s tokenomics.
What is token supply in cryptocurrency?
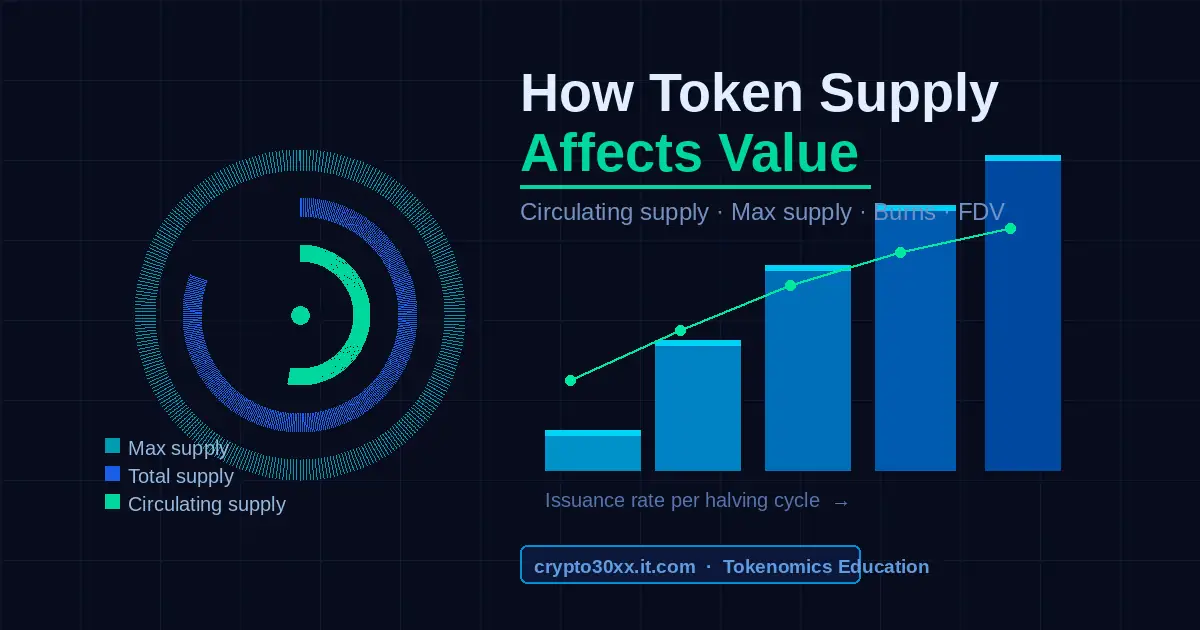
Token supply is the total number of units of a cryptocurrency that exist or will ever exist, measured across three distinct figures that each tell a different part of the story. Understanding how each figure works is the foundation of any supply-side analysis.
Circulating supply
Circulating supply is the number of tokens currently available and actively tradeable on the open market. It is the figure used to calculate a token’s market capitalization: price multiplied by circulating supply. This number changes constantly as new tokens are issued through mining rewards or staking emissions, and as tokens are locked or burned.
Total supply
Total supply is the count of all tokens that have been created so far, minus any that have been permanently destroyed through burning. It includes tokens that are locked in vesting contracts, held in project treasuries, or otherwise not yet in active circulation.
Maximum supply
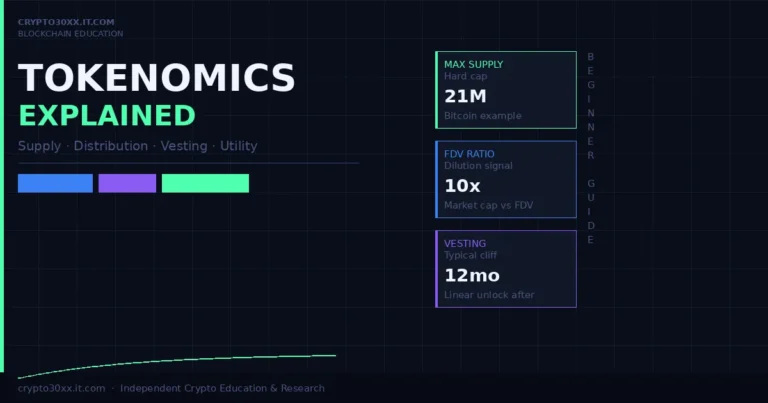
Maximum supply is the hard ceiling — the absolute most tokens the protocol will ever allow to exist. Bitcoin’s maximum supply is 21 million coins, encoded directly into the protocol and enforced by the network’s rules. Not all tokens have a maximum supply; Ethereum, for instance, has no hard cap, with issuance offset dynamically by burn mechanics.
Why the gaps between these three numbers matter
The difference between circulating supply and maximum supply represents future dilution. If a project has 10% of its tokens circulating today and the remaining 90% are scheduled to unlock over the next three years, each existing holder faces meaningful dilution pressure as those tokens enter the market. Analysts use the ratio of circulating supply to maximum supply as a quick signal: a low ratio means significant supply is still to come.
How does supply affect token value?
Token supply affects value through the same fundamental economic relationship that governs any scarce asset: when supply decreases relative to demand, each unit becomes more valuable; when supply increases faster than demand, each unit becomes less valuable. The distinct feature of cryptocurrency is that supply schedules are often programmed in advance and visible to anyone who reads the protocol documentation.
The scarcity principle
Scarcity creates value when demand is present. A protocol that limits its token count to a fixed ceiling signals to holders that no central authority can dilute their share by printing more tokens. Bitcoin’s 21 million coin cap is the clearest example in the asset class — by design, no additional coins can ever be issued beyond that limit. As mining rewards halve roughly every four years, the rate of new supply entering circulation decreases, which has historically corresponded to periods of changing market dynamics.
Dilution and its effect on holders
Dilution occurs when new tokens enter circulation faster than demand grows. If a holder owns 1,000 tokens representing 1% of a circulating supply of 100,000 tokens, and issuance doubles the supply to 200,000 tokens without any change in demand, that holder’s proportional share falls to 0.5%. Their token count stays the same; their share of the total network falls. This is the same mechanism that makes stock dilution concerning for equity investors — the principle transfers directly to token markets.
Supply and market capitalization
Market capitalization (market cap) = price × circulating supply. This means that if supply increases but market cap stays flat, price per token must fall to balance the equation. The practical consequence: projects with aggressive emission schedules must generate proportionally aggressive demand growth just to hold price steady. When emission outpaces adoption, downward pressure accumulates.
The three core token supply models
Cryptocurrency protocols fall into three broad supply models, each with a distinct economic logic and set of trade-offs for holders, users, and the network itself.
Fixed supply models
A fixed supply model caps the total number of tokens that will ever exist. Once the cap is reached, no new tokens can be minted. The value argument is straightforward: if demand grows while supply cannot, scarcity intensifies.
Trade-offs of fixed supply:
- Predictable long-term issuance schedule; no governance decision can expand supply
- No mechanism to fund ongoing network security once block rewards reach zero (a long-term design challenge for proof-of-work chains)
- Supply-side argument for value is strong, but demand must materialize for scarcity to translate into price appreciation
- Does not allow the protocol to respond dynamically to network conditions through token issuance
Bitcoin is the primary example: 21 million coins, issued through block rewards that halve approximately every 210,000 blocks (roughly four years), with issuance declining toward zero over time.
Inflationary supply models
An inflationary supply model continuously issues new tokens, typically to reward validators, stakers, or other participants who contribute to network security and operation. The rate of issuance can be fixed, percentage-based, or governance-controlled.
Trade-offs of inflationary supply:
- Provides ongoing incentives for network participation without requiring external funding
- Allows flexible adjustment of reward rates as network conditions change
- Creates continuous sell pressure as participants who earn rewards liquidate tokens
- Holders bear dilution costs unless the network’s demand growth outpaces issuance
The critical test for an inflationary model is whether the utility the network provides — transaction settlement, smart contract execution, governance participation — generates demand that absorbs the new supply. Networks with strong utility and growing adoption can maintain or grow per-token value despite ongoing issuance; networks with weak demand face compounding dilution.
Deflationary and hybrid supply models
Deflationary models reduce the total token supply over time through mechanisms that permanently remove tokens from circulation. Hybrid models combine elements of both inflationary issuance and deflationary removal, with the net direction of supply change depending on network conditions.
Token burning is the most common deflationary mechanism. Tokens are sent to an address for which no private key exists — they are permanently irretrievable and therefore removed from the circulating supply. Burns can be scheduled (at fixed intervals), transaction-based (a portion of every fee is burned), or governance-triggered.
Ethereum’s implementation after EIP-1559 is the most widely studied example of a hybrid model in practice. The protocol issues new ETH to validators as staking rewards (inflationary), while simultaneously burning the base fee from every transaction (deflationary). Whether Ethereum is net inflationary or deflationary at any given time depends on network activity: high transaction volumes produce higher burns, which can exceed new issuance and result in net supply contraction.
Supply model comparison
| Feature | Fixed supply | Inflationary | Deflationary / Hybrid |
|---|---|---|---|
| Total supply direction | Stable (capped) | Expanding | Shrinking or variable |
| New token issuance | Only until cap is reached | Continuous | Continuous (offset by burns) |
| Primary value argument | Scarcity via hard cap | Utility and adoption | Scarcity through reduction |
| Main risk | Demand may not materialize | Dilution if demand lags | Liquidity reduction; model complexity |
| Network security funding | Block rewards only | Ongoing staking/mining rewards | Rewards persist alongside burns |
| Example protocols | Bitcoin | Many proof-of-stake chains | Ethereum post-EIP-1559 |
| Governance flexibility | Low | Medium to high | Medium |
Fully diluted valuation: reading the supply overhang
Fully diluted valuation (FDV) is the theoretical total market value of a token if every planned token — including all currently locked, unvested, or unissued tokens — were in circulation at the current price. The formula:
FDV = current price × maximum supply
FDV is almost always higher than market cap, because most projects have not yet released their full planned supply. The gap between market cap and FDV shows the supply overhang: the dilution that future token releases will impose on current holders if price stays constant.
A neutral illustration
Assume a token trades at $1.00. Its circulating supply is 100 million tokens, giving a market cap of $100 million. Its maximum supply is 1 billion tokens — meaning 900 million tokens are yet to be released. FDV = $1.00 × 1 billion = $1 billion. The market cap is 10% of FDV. This means that if all remaining tokens entered circulation at today’s price with no increase in demand, each existing holder’s proportional value would be diluted by a factor of ten.
In practice, prices rarely stay constant as supply increases. But the ratio of market cap to FDV (often called the MC/FDV ratio) is a structural metric: a very low ratio signals that significant supply is still pending. Analysts treat a low ratio not as a prediction but as a caution — the project needs substantial demand growth to absorb what is coming.
What FDV does not tell you
FDV assumes a constant price, which is a simplification. It does not account for the possibility that demand grows alongside supply, which would support price. It also does not specify the timing of unlocks — tokens scheduled to release over five years impose very different pressure than tokens releasing in a single event next month. FDV must be read alongside the unlock schedule to be analytically useful.
Vesting schedules and unlock events
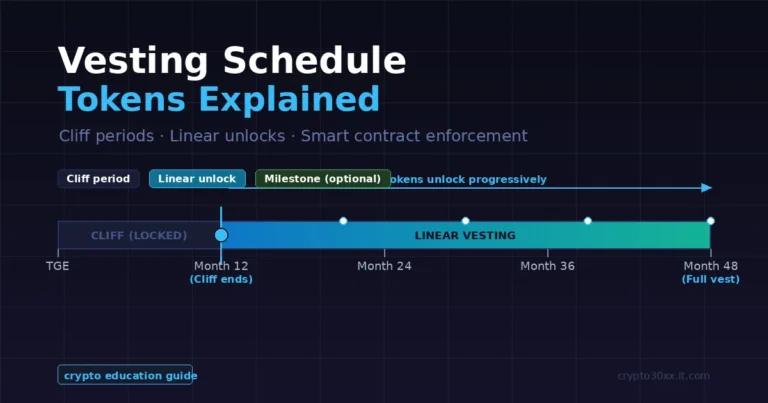
Most new token projects distribute tokens to founders, early investors, and advisors through vesting schedules — structured release calendars that prevent large holders from selling all their tokens immediately after launch. Vesting is a governance tool for managing supply-side pressure.
A typical vesting structure includes:
- A cliff period: a minimum duration during which no tokens are released (often 6–12 months)
- A linear release: tokens unlocked gradually over the remainder of the vesting period (often 24–36 months from the cliff)
- A fully diluted date: when all scheduled tokens have entered circulation
From a supply analysis standpoint, major unlock events — when large tranches of vested tokens become tradeable — represent moments of potential sell pressure. Holders who received tokens at a fraction of the current market price have significant incentive to liquidate. If the unlock volume is large relative to typical daily trading volume, the market may struggle to absorb the additional supply without price adjustment.
The analytical discipline here is to cross-reference unlock calendars against circulating supply ratios. A project with 20% circulating supply today but a large cliff expiry in six months carries supply-side risk that its surface-level market cap does not capture.
Common misconceptions about supply and value
“Low price means low supply — it must be cheap”
This is one of the most prevalent analytical errors in retail crypto analysis. A token priced at $0.001 is not necessarily cheap, and a token priced at $50,000 is not necessarily expensive. The per-unit price is a function of both supply and demand. A token with a trillion-unit circulating supply will have a very low per-unit price even at a substantial market cap. The relevant metric for comparative value is market capitalization, not unit price.
“A token burn automatically increases value”
Burns reduce supply, but supply reduction only translates to value appreciation when demand stays constant or grows. If a project burns 10% of its supply while demand collapses 50%, the burn does not prevent value destruction. Burns are a supply-side tool; their effect on value depends entirely on the demand environment in which they operate.
“Inflationary tokens cannot appreciate”
Demand-side growth can more than offset supply inflation. A network that processes significantly more transactions each year, with each transaction generating real economic value, can sustain or grow per-token value despite ongoing issuance — provided the utility demand is genuine. The determining factor is the ratio between demand growth rate and supply growth rate, not whether issuance exists at all.
“A fixed supply guarantee is sufficient”
Fixed supply removes one form of risk but does not guarantee value. A token with a 21-unit supply and zero utility or adoption has no value floor. Supply constraints are a necessary but not sufficient condition for sustained value. Demand, utility, adoption, and network security all contribute to the full picture.
How to evaluate a token’s supply structure
For researchers and analysts approaching a new project, a structured supply review covers several key data points. These are typically disclosed in the project’s whitepaper, verified by on-chain data, and tracked by analytics platforms.
- Identify the three supply figures: circulating supply, total supply, and maximum supply. Note whether a hard cap exists.
- Calculate the MC/FDV ratio: divide current market cap by FDV. A ratio below 0.20 indicates that more than 80% of the supply is not yet circulating.
- Map the emission schedule: how many new tokens are issued per block, per day, per year? Is the schedule fixed or governance-adjustable?
- Locate unlock events: when do large vesting tranches release? Cross-check dates against the size of the unlocking tranche relative to daily volume.
- Assess burn mechanisms: if burns exist, are they automatic (transaction-based) or discretionary (team-controlled)? What is the net supply trend — inflation minus burns?
- Read the allocation breakdown: what percentage of supply was allocated to the team, early investors, ecosystem, and public? Large insider allocations with short vesting schedules are a structural risk.
- Check historical emission data: on-chain data shows actual issuance history. Compare planned emission to actual emission to identify any deviations from stated schedules.
FAQs
What is the difference between circulating supply and total supply? Circulating supply is the count of tokens actively tradeable in the market right now. Total supply includes all tokens that have been created, whether or not they are currently tradeable — including locked, vested, or treasury-held tokens. Tokens that have been permanently burned are excluded from total supply.
Why does a high FDV relative to market cap matter? A high FDV with a low market cap indicates that a large portion of the maximum supply is not yet circulating. As those tokens unlock and enter the market, they represent potential sell pressure. If demand does not grow to absorb that supply, price per token can fall even if the market cap stays flat, because the same total value is spread across more units.
Can an inflationary token gain in value? An inflationary token can gain in value if demand for the token grows faster than the rate of new supply issuance. The critical variable is the relationship between adoption growth and the emission rate. A network with a 5% annual issuance rate but rapidly expanding usage can see per-token value increase despite ongoing dilution.
What is a token burn and how does it affect supply? A token burn is the permanent removal of tokens from circulation. Burned tokens are sent to an address with no accessible private key, making them irretrievable. Burns reduce total supply and, all else equal, increase each remaining token’s share of the total. Their actual effect on value depends on whether demand conditions support the reduced supply.
What is vesting in crypto tokenomics? Vesting is a structured schedule that releases tokens to founders, investors, or other early recipients over a defined period, rather than all at once. Vesting schedules limit immediate sell pressure by preventing large holders from liquidating their entire position at token launch. Analysts monitor upcoming vesting cliff dates because large token unlocks can increase circulating supply quickly and create selling pressure.
Does Bitcoin’s halving directly cause price increases? Bitcoin’s halving reduces the rate of new BTC entering circulation by 50% approximately every four years. This is a supply-side event — it changes the rate of issuance, not existing holdings. Whether and how this supply reduction translates to price change depends on demand conditions at the time of the halving. The halving is a verifiable, protocol-enforced supply mechanic, not a price guarantee.
What is the fully diluted valuation formula? FDV = current token price × maximum token supply. For projects without a hard cap, some analysts substitute a projected future supply at a defined horizon. FDV is a theoretical metric that assumes current price remains constant as all remaining supply enters circulation — a simplification useful for structural comparison, not price prediction.
How do I find a token’s supply data? Supply data is typically available on token analytics platforms such as CoinGecko and CoinMarketCap, which display circulating supply, total supply, and max supply for listed assets. The project’s whitepaper and official documentation are the primary sources for emission schedules, allocation breakdowns, and vesting terms. On-chain block explorers provide independent verification of actual circulating supply.
Disclaimer
This article is produced by crypto30xx.it.com as an independent educational resource for learners, researchers, and market observers. Nothing in this article constitutes financial advice, an investment recommendation, or a solicitation to buy or sell any asset. Cryptocurrency markets carry significant risk, including the risk of total loss of capital. All supply mechanics and examples in this article are illustrative and educational in nature. Readers should conduct their own research and consult a qualified financial professional before making any investment decisions.
Token supply is not the only variable that determines a cryptocurrency’s value — utility, adoption, network security, and market demand all play central roles. But supply structure is the most objectively measurable factor available before a project gains market history. A clear understanding of circulating supply ratios, emission schedules, burn mechanics, and unlock calendars gives analysts the structural foundation to evaluate what a token’s price must do for its economics to remain sustainable. The tools described in this guide — FDV, MC/FDV ratio, vesting schedules, and supply model classification — are starting points for that analysis, not conclusions in themselves.
Our daily content is designed to give your mind the rest it deserves after every long hard day.