How to identify meme coin pumps: key signals explained
How to identify meme coin pumps: A meme coin pump is a rapid, abnormal price increase in a low-market-cap token, typically one driven by social media activity, coordinated messaging, or sudden liquidity injection rather than fundamental development. These events follow recognizable structural patterns across on-chain data, trading volume, and social sentiment. This guide is written for learners and researchers who want to understand how these patterns form and how analysts track them. It does not offer trading signals, buy recommendations, or predictions about specific tokens. Identifying a pump means recognizing a cluster of signals simultaneously; no single indicator is definitive. Signal analysis in this field spans four main areas: volume behavior, on-chain metrics, social velocity, and the structural phases of a pump cycle.
What is a meme coin pump?
A meme coin pump occurs when the price of a token, typically one with no significant utility or development history, rises sharply over a compressed period, driven by factors unrelated to any change in the project’s fundamentals. These events can be organic, the result of genuine mass interest arriving simultaneously, or coordinated, engineered by a group of wallets or promoters acting with shared intent. Both types follow analyzable patterns.
Organic vs. coordinated pumps
Both types produce similar price chart shapes, which is why analysts look beyond price alone. An organic pump tends to show broad holder distribution across many wallets entering simultaneously, with social volume rising in a scattered, decentralized pattern across multiple platforms. A coordinated pump typically shows a small number of wallets accumulating before any price movement, followed by social volume spiking in concentrated clusters across specific Telegram channels, Discord servers, or Twitter/X accounts posting in a tight time window.
The distinction matters analytically. Even organic pumps often produce steep, rapid reversals once initial demand saturates, because tokens are typically held in highly concentrated wallets regardless of how the price event started.
Why meme coins are structurally prone to pump patterns
Three structural features make pump mechanics more executable on meme coins than on established assets. Low initial market capitalization means smaller capital moves prices significantly; thin liquidity pools mean individual orders create outsized price effects. High social dependency means price action and narrative are tightly coupled, rather than grounded in development milestones or revenue data.
How do volume signals reveal a potential pump?
Volume signals are often the first measurable indicator of an emerging meme coin pump. In normal market conditions, a token’s trading volume follows a relatively stable baseline tied to broader market cycles. When volume detaches from this baseline and rises sharply within hours, the pattern signals unusual activity that warrants structured analysis across additional data layers.
Trading volume-to-market-cap ratio
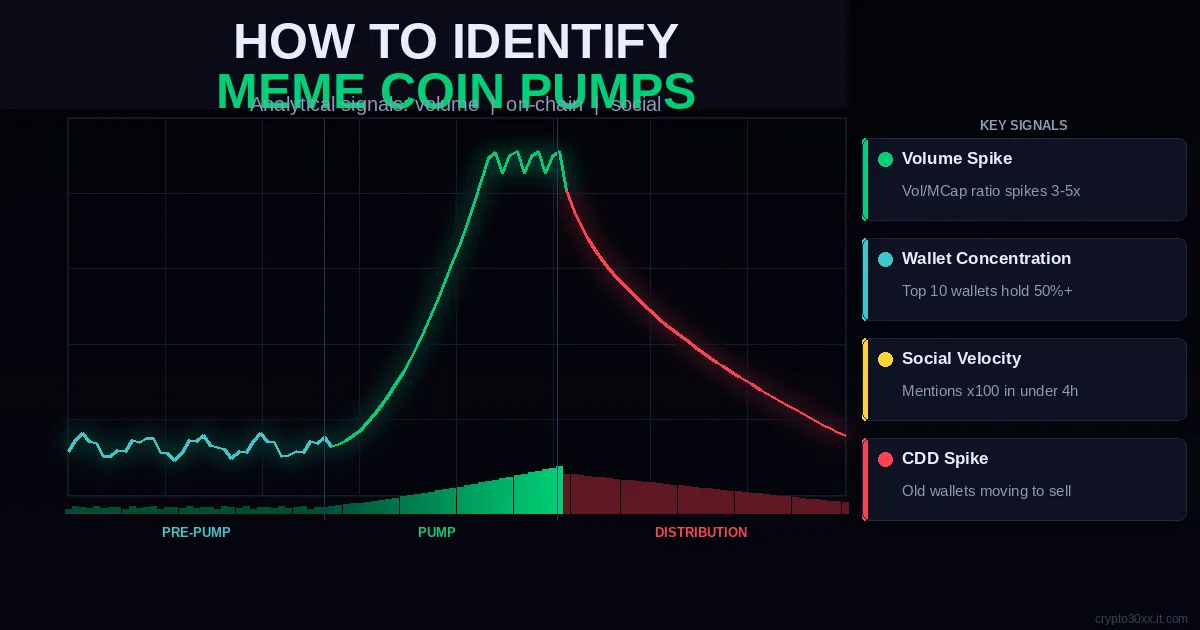
One standard analytical measure is the trading volume-to-market-cap ratio. On most days, established tokens trade a small fraction of their total market capitalization. A ratio above 0.5 — meaning 50% or more of a token’s market cap changes hands in a single session — is structurally unusual for any asset. For low-cap meme coins, this ratio can reach 3x, 5x, or higher during active pump phases.
High volume does not confirm a pump on its own. It is a threshold signal: once crossed, it warrants investigation across the other data layers covered below.
Liquidity pool depth and slippage
For tokens trading on decentralized exchanges, the depth of the liquidity pool is a key variable. A thin pool means that even modest buy orders can move the price significantly, reducing the capital required to create a visible price move. Analysts examining DEX pairs look at total value locked (TVL) relative to incoming order volume. When large buy orders hit a shallow pool, the token’s price per unit rises faster than it would on a deep-liquidity pair, amplifying the visual appearance of a strong move.
Volume diverging from price
A particularly significant signal is trading volume that rises sharply while price begins to plateau or fall. This pattern indicates that sellers are absorbing buy pressure at the same price level, which is the structural fingerprint of the distribution phase. Rising volume on a declining price differs fundamentally from rising volume on a rising price, and the two patterns carry different analytical implications.
What on-chain signals precede a pump?
On-chain data gives analysts access to information that does not appear on any price chart. Block explorers and dedicated analytics tools make this data publicly visible for any token contract. Three signal categories are most relevant: wallet distribution, address creation rate, and token age consumed.
Wallet concentration
Token distribution among holders is visible on most block explorers. When a small number of wallets hold a disproportionate share of the total token supply, the structural risk of a coordinated exit at a price target increases substantially. Standard analytical checks include the percentage of supply held by the top 10 wallets, the top 50 wallets, and how recently those wallets acquired their holdings.
A token where the top 10 wallets control 40–60% or more of total supply presents significant concentration risk. Analysts document this figure as a baseline and track whether concentration is increasing or decreasing over time.
New wallet creation rate
A rapid increase in wallet addresses interacting with a specific token contract is a measurable pre-pump signal. When a coordinated group begins promoting a token, new wallets are created and funded in quick succession. On-chain tools that track unique address growth per hour for a specific contract can reveal this acceleration before any movement appears on a price chart.
Token age consumed
Coin days destroyed (CDD), or its token equivalent, measures how long tokens have been held before they are moved. A spike in this metric for a specific token means that wallets which held positions for an extended period have begun moving them, often toward exchanges in preparation for a sale. When this signal appears ahead of a sharp price rise, it frequently indicates that early accumulation wallets are positioning to distribute into incoming demand.
Developer and insider wallet behavior
Where a token’s development wallet or initial distribution address is publicly identifiable, tracking those addresses provides additional context. Movement from wallets tied to project insiders ahead of a price event is a documented behavioral pattern in pump cycle analysis. Block explorers make this tracking publicly accessible.
How social signals map onto pump events
Social activity in meme coin markets does not lag behind price the way it typically does in other asset classes. Rather than responding to development news, price action in this category is often triggered by or directly proportional to social momentum. Understanding how social signals map onto price events helps analysts distinguish genuine community interest from coordinated narrative construction.
Social volume velocity
Social volume refers to the count of mentions of a token across platforms within a defined time window. Absolute mention count matters less than velocity, the rate at which mentions accelerate. A token moving from 20 mentions per hour to 2,000 within four hours is exhibiting a pattern structurally consistent with coordinated promotion rather than organic discovery. Research platforms that include social analytics allow analysts to overlay mention velocity with price and volume data simultaneously.
Coordinated messaging patterns
Coordinated pump groups typically distribute promotional messages across multiple channels at once. Observable patterns include:
- Near-identical phrasing appearing across different accounts within a short window
- A sudden increase in project-linked account followers with no preceding development announcement
- Clusters of low-history wallets all interacting with the same contract at similar timestamps
- Influencer posts appearing in a tight time window across accounts that do not ordinarily interact
None of these patterns is conclusive in isolation. Together, they form a combined indicator that analysts treat as analytically significant.
How to structure a meme coin pump analysis
Applying signal analysis to a specific token requires examining multiple data layers in sequence rather than reacting to a single visible indicator. The following steps reflect how on-chain and market analysts typically approach this work.
- Identify the token contract address: Pull the address from the project’s official channel or a DEX pair listing and verify it on the relevant block explorer before analyzing anything else.
- Check holder concentration: Look at what percentage of supply the top 10 and top 50 wallets hold. Note when those wallets first acquired their tokens and from which source addresses.
- Examine liquidity pool depth: Find the primary trading pair on a DEX analytics platform. Record TVL, pool age, and whether liquidity was added in a short burst or has been growing gradually over time.
- Calculate the volume-to-market-cap ratio: Divide the 24-hour trading volume by the token’s total market capitalization. A ratio above 1.0 is structurally extreme for any asset.
- Track new wallet address growth: Use an on-chain analytics tool to view unique address growth for the contract over the past 12–48 hours. A sharp acceleration from a low baseline is notable.
- Review coin days destroyed data: Check whether long-held tokens are being moved. A CDD spike ahead of a price event is a documented pre-distribution signal.
- Measure social volume velocity: Find the token’s mention count per hour over the past 24–48 hours and compare this rate to the baseline from the previous week.
- Assess messaging pattern consistency: Search the token name across platforms. Evaluate whether promotional content is varied and organic or repetitively phrased and tightly clustered by time.
No single step in this process produces a definitive conclusion. The value is that it structures observation of multiple signals simultaneously rather than reacting to the most visible one.
The lifecycle of a pump event
Meme coin pumps follow a recognizable three-phase structure visible across price, volume, and on-chain data. Each phase has distinct characteristics, and the signals that matter most shift as the event progresses.
| Phase | Typical duration | Key characteristics | Observable signals |
|---|---|---|---|
| Pre-pump | Hours to days | Wallet accumulation, minimal social noise | Rising address count, thin liquidity, flat price |
| Pump | Minutes to hours | Rapid price rise, social explosion | Volume spike, social velocity surge, new wallet rush |
| Distribution | Minutes to hours | Price plateau, then sharp decline | Whale wallet exits, CDD spike, rising volume on falling price |
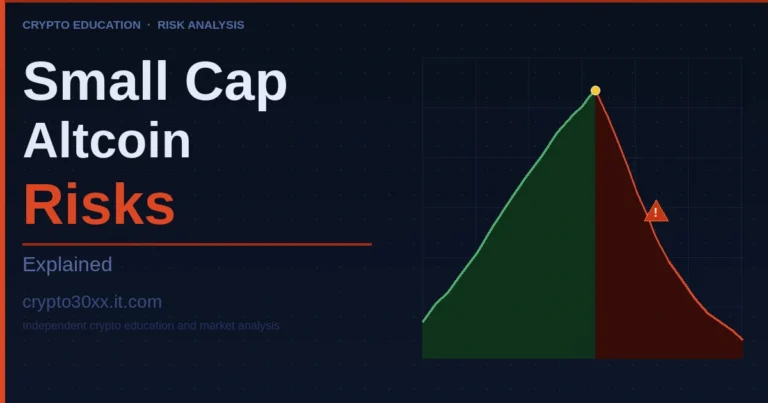
The pre-pump phase is analytically the richest window but the hardest to detect in real time, since the token appears quiet on price charts. The pump phase becomes visible to most observers, but the setup is already advanced by the time broad interest arrives. The distribution phase — where early holders exit into retail demand — is often the only phase visible to the majority of participants, and it is the phase in which most losses occur.
Common misconceptions in pump analysis
Several analytical errors consistently appear when studying meme coin price patterns for the first time. The most common involve treating individual signals as conclusive or confusing structural conditions with active behavioral signals.
Price increase alone is not a signal
A sharp price increase is the most visible symptom, but by the time it appears on a chart, the setup phase is already complete. Analysts working exclusively from price data observe the effect, not the cause.
High social volume is not always coordinated
Genuine community tokens have experienced organic viral moments where social volume spiked without pre-positioning by concentrated wallets. DOGE’s multiple documented viral cycles demonstrate that mass organic interest can drive price action without structured coordination. The analytical task is reading social signals alongside on-chain data, not treating social volume alone as evidence of manipulation.
Liquidity pool depth is not the whole picture
A deep liquidity pool reduces the ease of price manipulation but does not eliminate it. Large coordinated buyer groups can move even relatively liquid markets. Pool depth is one variable in a multi-factor framework, not a binary safe/unsafe classification.
Low market capitalization is not a pump signal
Meme coins are structurally low-cap by nature. Small market capitalization alone is not a signal; it is a structural condition that makes pump mechanics easier to execute. The signal comes from behavioral data layered on top of that condition.
FAQs
What tools do analysts use to track meme coin pump signals? Common analytical platforms include block explorers (Etherscan, BscScan, Solscan) for on-chain data, DEX analytics tools (DexScreener, DEXTools) for liquidity and volume metrics, and on-chain research platforms (Nansen, Glassnode) for wallet behavior data. Social sentiment trackers aggregate mention velocity across platforms. Using these tools in combination gives analysts a multi-layer view of any specific token’s activity.
Can a meme coin pump be identified before it starts? Pre-pump accumulation is visible on-chain for analysts monitoring the right metrics. Wallet concentration changes, rising contract interactions from new addresses, and thin liquidity paired with accelerating social mentions can indicate early-stage positioning. These signals are probabilistic, not predictive — they identify conditions associated with pump events historically, not guaranteed future outcomes.
How long does a typical meme coin pump last? Duration varies substantially. Some events compress into under an hour; others sustain across multiple days before a sharp reversal. The key structural variable is liquidity pool depth and the number of accumulation wallets coordinating their exits. Shallow pools with concentrated holders tend to produce faster, sharper cycles.
Is identifying a meme coin pump the same as being able to profit from it? Analytically, no. Recognizing a pattern does not give an observer control over timing. The distribution phase can begin before most participants realize the price has peaked. Many observers who correctly identify a pump event still experience losses because they entered during the pump phase rather than during pre-pump accumulation.
What is the difference between a meme coin pump and an organic price rally? The structural distinction lies in on-chain data. Organic rallies tend to show broad, decentralized holder growth, gradual liquidity increases, and social volume rising over days rather than hours. Pump events show tight wallet concentration, recently added or thin liquidity, and a near-vertical price-volume profile compressed into a short window.
Are coordinated pump-and-dump schemes legal? In most regulated securities markets, coordinated price manipulation is illegal. The legal classification of meme coins varies significantly by jurisdiction, and many tokens operate outside existing securities frameworks. Regulatory treatment of crypto market manipulation continues to evolve across different countries. This article describes these patterns for educational analysis only, not to facilitate any prohibited activity.
Does on-chain data update in real time? Block confirmations happen continuously, and most on-chain analytics platforms update within seconds to minutes of a transaction being confirmed. This means wallet accumulation signals can appear before price movements are visible on standard charting tools — which is why on-chain data analysis is central to this field of study.
Disclaimer
This article is produced by an independent cryptocurrency education and market analysis blog and is intended for educational and research purposes only. Nothing in this article constitutes financial, investment, or trading advice. Meme coin markets carry extreme volatility and substantial risk of capital loss. Readers should conduct independent research and consult qualified financial professionals before making any investment decision.
Meme coin pumps are identifiable through a convergence of signals, not through any single metric. Volume-to-market-cap ratios flag unusual trading activity. On-chain wallet concentration and CDD data reveal accumulation and pre-distribution behavior. Social velocity separates coordinated promotion from organic interest. And the three-phase lifecycle model maps where each analytical tool is most informative. For researchers and analysts exploring this field, block explorers and on-chain analytics platforms make the underlying data publicly accessible at no cost. The data is there; the analytical value lies in the structured framework used to interpret it.
Every topic covered, every question answered—welcome to our complete content hub.